What’s Next After Celestia (TIA) Price Reaches New All-Time High?

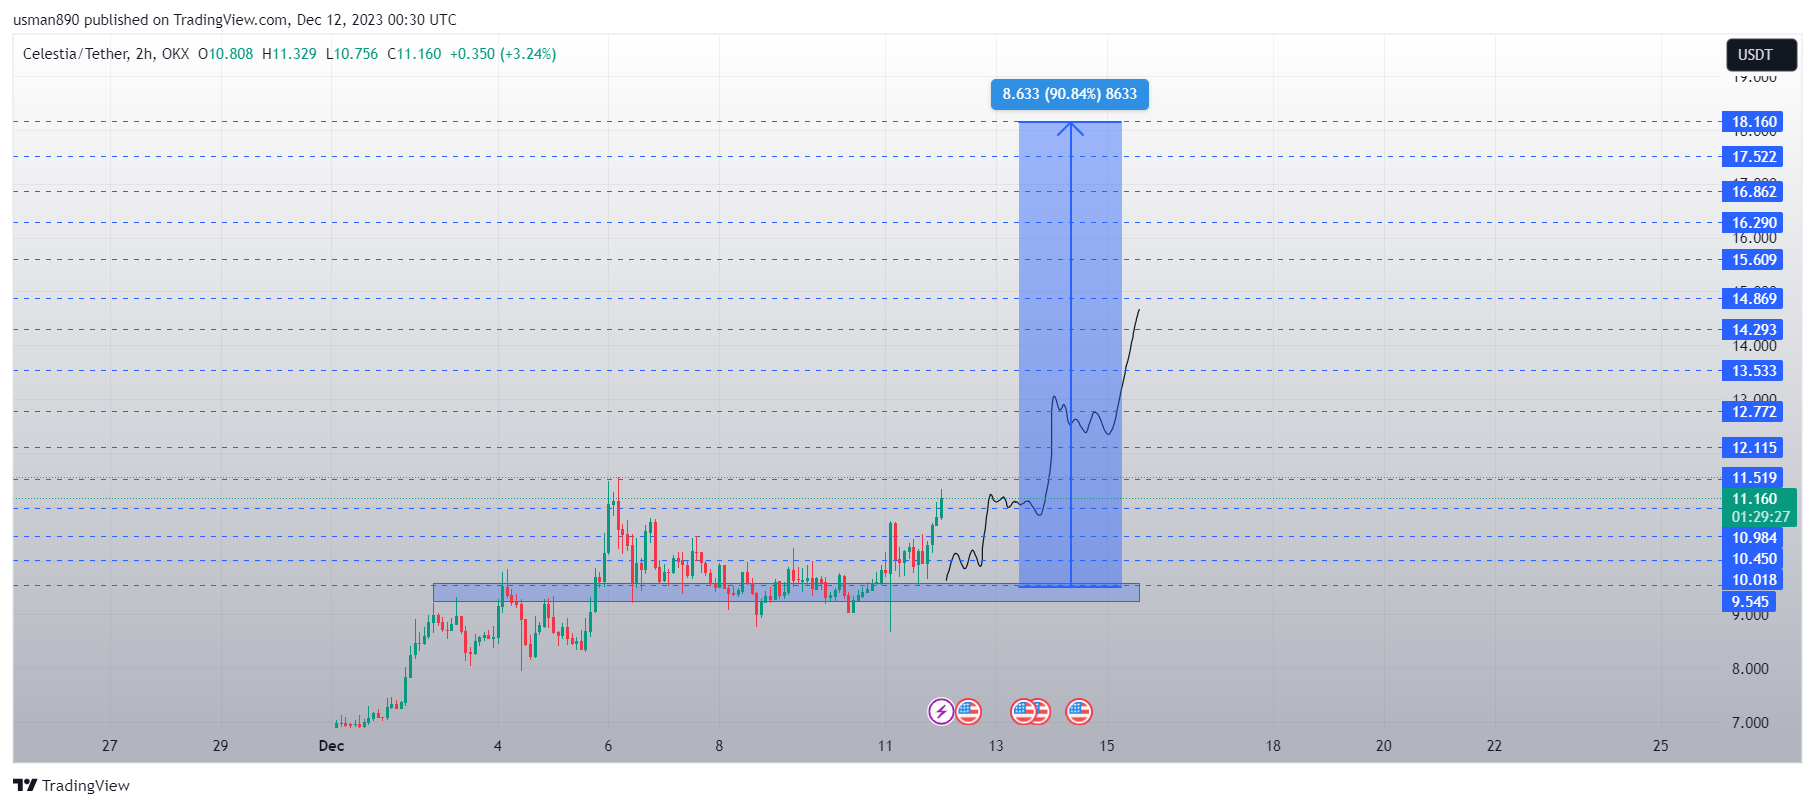
The Celestia (TIA) price has increased since November 10, reaching a new all-time high of $12.47 today.
Despite the high, TIA has not broken out from its central pattern yet. Will it do so shortly?
TIA Increase Culminates With New High
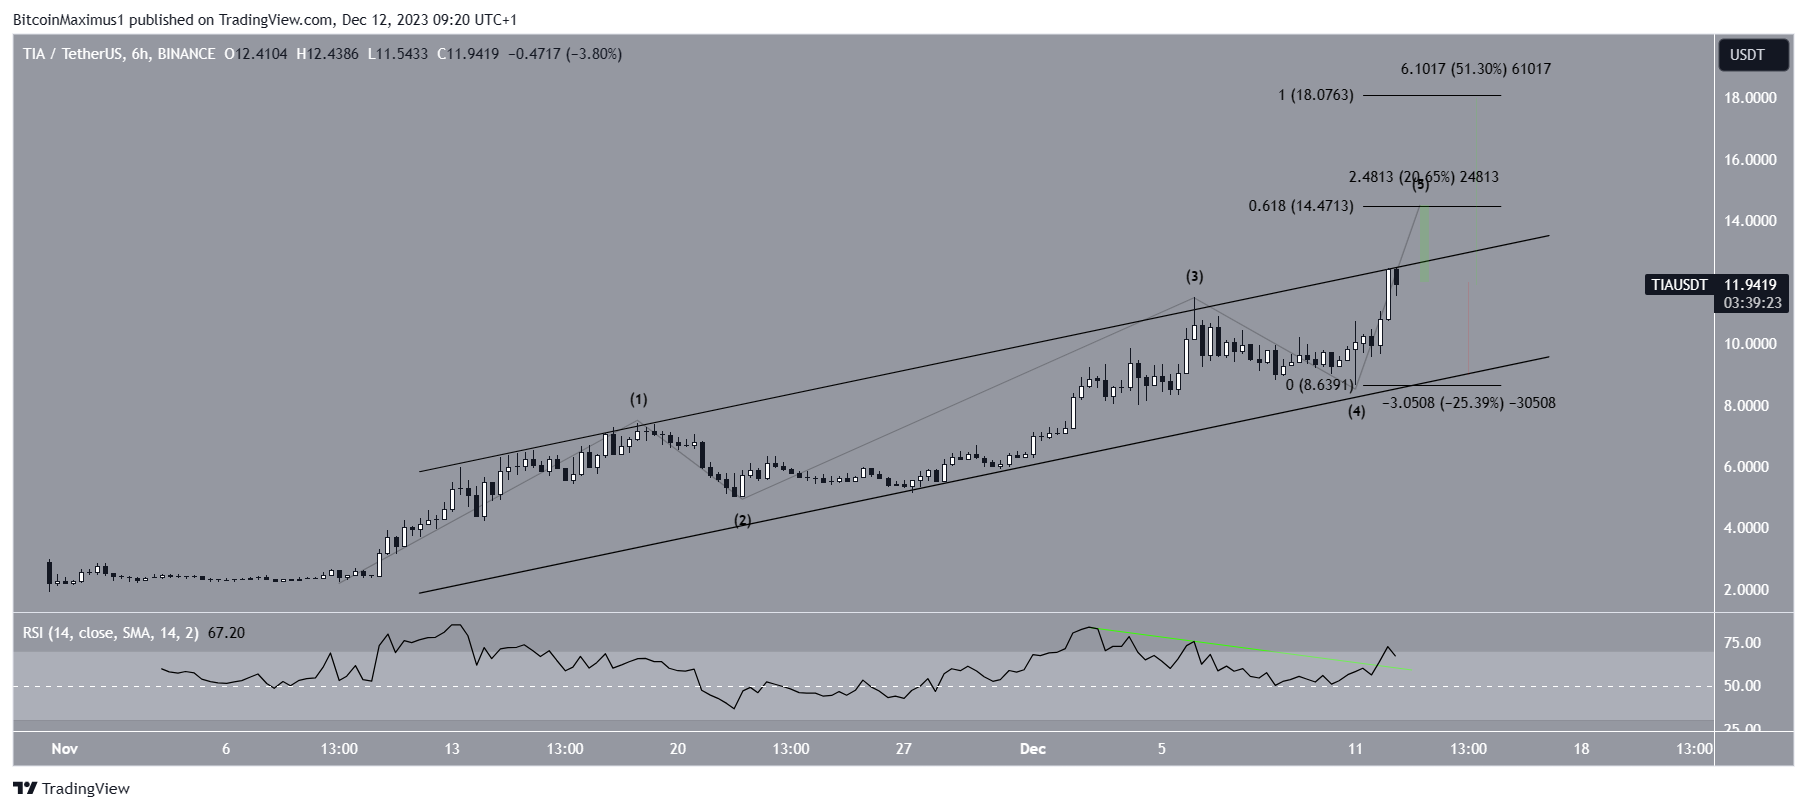
The TIA price has moved upward quickly since falling to a low of $2.43 on November 10. The entire movement has been contained inside an ascending parallel channel. The pattern’s resistance and support trend lines have been validated numerous times.
After bouncing at the channel’s support line on November 27 (green icon), the altcoin increased significantly and culminated with a new all-time high price of $12.47 today. The high was at the channel’s resistance trend line (red icon).
Several cryptocurrency traders and analysts noted the massive TIA increase. CryptoGodJohn suggested that the movement is reminiscent of that of Solana (SOL), stating that:
$TIA giving early 2021 $SOL vibes before it went parabolic
CryptoKnight suggested that the increase will continue until $20.

Finally, Kelvin Talent boasted about his previous correct call, which showed a breakout from a descending wedge, leading to an all-time high in the new TIA price.
Read More: Top 9 Telegram Channels for Crypto Signals in 2023
Celestia Price Prediction: Is $20 Within Reach?
Elliott Wave theory involves the analysis of recurring long-term price patterns and investor psychology to determine the direction of a trend.
The most likely count suggests that the price began a five-wave upward movement in November. It is currently in the fifth and final wave of this increase.
With the RSI as a momentum indicator, traders can determine whether a market is overbought or oversold and decide whether to accumulate or sell an asset. Bulls have an advantage if the RSI reading is above 50 and the trend is upward, but if the reading is below 50, the opposite is true.
The six-hour RSI supports the continuing of the increase. The indicator broke out from its bearish divergence trend line (green), is above 50, and is increasing all bullish signs.
If the TIA price breaks out from the channel, the first target for the top of the fifth wave is $14.50, 20% above the current price. The target is found by giving wave five 0.618 times the length of wave one.
The second most likely target for the movement’s top is $18,10, giving wave five the same length as waves one and three combined. An increase of 50% is required for the altcoin to reach it.

Despite this bullish TIA price prediction, a significant rejection at the channel’s resistance trend line will mean the upward movement is complete. Then, a 25% decrease in the channel’s support line will be likely.
Read More: Best Crypto Sign-Up Bonuses in 2023
For BeInCrypto’s latest crypto market analysis, click here.
Disclaimer
In line with the Trust Project guidelines, this price analysis article is for informational purposes only and should not be considered financial or investment advice. BeInCrypto is committed to accurate, unbiased reporting, but market conditions are subject to change without notice. Always conduct your own research and consult with a professional before making any financial decisions.


