Bitcoin (BTC) Price Analysis Offer Optimistic Signs

Over the weekend, Bitcoin (BTC) ‘s price circled between $54,424 and $58,215. However, as the new week begins, the coin presents an interesting revelation on-chain that could influence its next direction.
To put it in perspective, this condition has been historically crucial to BTC’s recovery. Will it be the same this time?
Bitcoin Oversold, Drives Multiple Bids
The metric in question is the NVT Golden Cross. NVT stands for Network Value to Transaction. Defined as a reformed index of the NVT ratio, the metric gauges if Bitcoin has hit the bottom or is at the top.
When the value of this metric is 2.20 or above, it means the coin has hit the top, and a decline is imminent. As seen in the image below, this happened in December 2023, March 2024, and most recently, May.
Comparatively, if the NVT Golden Cross is under -1.60, it means that BTC is near or has hit the bottom.
Currently, the metric is at -1.39, a potential sign of overselling. This selling pressure can be linked to Mt. Gox’s recent movement of BTC.
Apart from that, the numerous transfers by the German government played a part. However, as it stands, the coin may be on the path of recovery, as overselling could foreshadow a rebound.
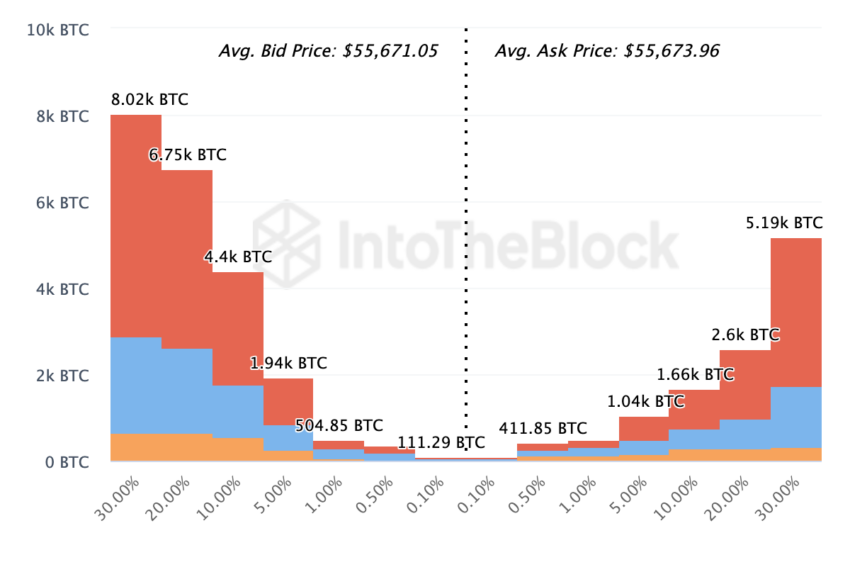
Furthermore, market participants seem to be waiting in line to buy BTC at the current discount prices. BeInCrypto discovered this after examining the Exchange On-chain Market Depth.
Read More: How to Buy Bitcoin (BTC) on eToro: A Step-by-Step Guide
This metric considers the activities on the order books of the top 20 exchanges. Divided into two parts, Exchange On-chain Market Depth considers the bid (buy) and ask (sell) segments.
According to IntoTheBlock, participants have placed bids for 22,075 BTC at an average price of 55,671. However, the total value of BTC set to be offloaded is 11,514 BTC at an average price of $55,673

Considering the higher value to be bought, Bitcoin’s price may evade another downturn and recover some of its recent losses.
BTC Price Prediction: No More Collapse
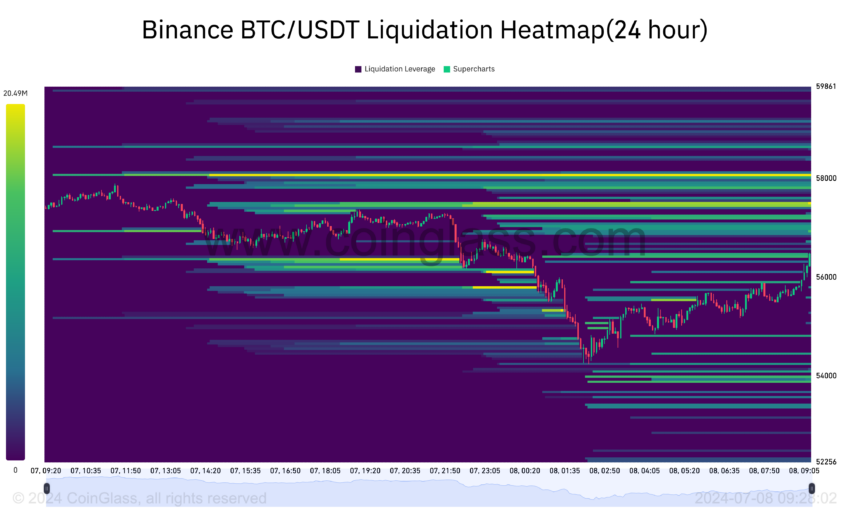
At press time, Bitcoin is trading at $56,752. However, the Liquidation Heatmap suggests that the price could be higher in the short term.
Liquidations Heatmap uses color variations to gauge the intensity of buy and sell orders in the market. Cooler colors like purple indicate a low level of activity. But when colors like green or yellow appear, it means the liquidity is concentrated at a price level.
By analyzing the heatmap, one can spot potential areas of interest, resistance, and support levels.
According to Coinglass, there is a high level of liquidity at $57,516 and another at $58,037. This high level of liquidity could attract a Bitcoin price increase in these regions.
Read More: Bitcoin (BTC) Price Prediction 2024/2025/2030

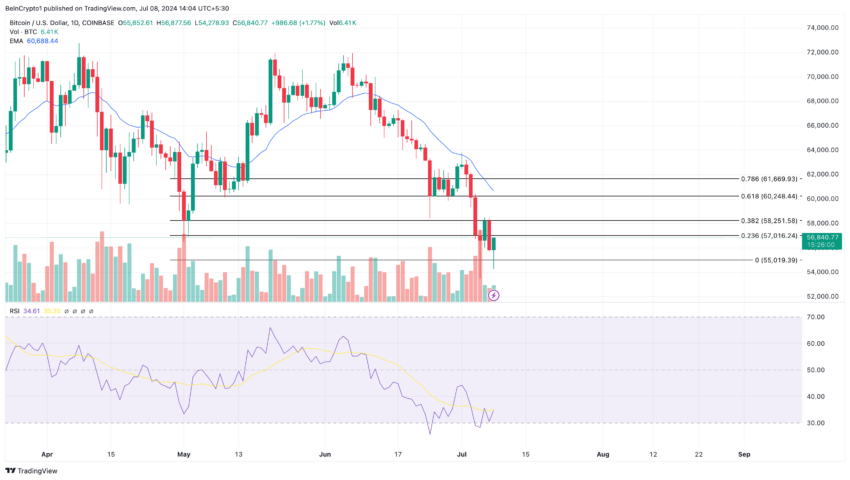
The Relative Strength Index (RSI), which measures momentum, also supports this potential. On the daily BTC/USD chart, it is at 34.61.
When the indicator’s reading is below 30.00, it is oversold. When it is above 70.00, it is overbought. Therefore, the RSI’s position implies that Bitcoin has left the oversold region and aims for substantial recovery.
Going by the positions of the Fibonacci Retracements, which spot supports and resistance points, BTC may retest $58.251 if it breaks through $57,016.

Meanwhile, RektCapital, a pseudonymous analyst on X, also commented on Bitcoin’s price action. According to him, the coin may have left sideways trading while closing in on re-accumulation.
“Bitcoin is on the cusp of performing its first Weekly Candle Close below the Re-Accumulation Range Low for the first time in the over four months that this range has existed,” Rekt Capital posted.
However, the coin still trades below the 20-day Exponential Moving Average (EMA), which tracks price changes to determine a trend’s strengths or weaknesses.
If Bitcoin’s price is above the 20-day EMA, it would indicate a solid bullish trend. However, as long as the coin wobbles below the threshold, it risks retracement to $55,019.
Disclaimer
In line with the Trust Project guidelines, this price analysis article is for informational purposes only and should not be considered financial or investment advice. BeInCrypto is committed to accurate, unbiased reporting, but market conditions are subject to change without notice. Always conduct your own research and consult with a professional before making any financial decisions. Please note that our Terms and Conditions, Privacy Policy, and Disclaimers have been updated.


