Bitcoin, Shiba Inu, Vechain price outlook

Bitcoin looks likely to extend gains above $50,000, while SHIB and VET might target moves above key price barriers
A bullish scenario has the price of Bitcoin (BTC) eyeing another attack at $50k, while an uptick in sentiment across the crypto market could see coins like Shiba Inu (SHIB) and Vechain (VET) breach key resistance levels in the next few days.
Bitcoin price
The positive technical picture for BTC price has the support of the weekly RSI, which is trending towards overbought conditions. The weekly MACD is also flashing a bullish crossover, while the Parabolic SAR is below the price to highlight a potential uptrend is on.
BTC/USD weekly chart. Source: TradingView
According to pseudonymous technical analyst Rekt Capital, Bitcoin bulls need a decent run to $51,000 if they are to marshal a new bull run. In this case, upside targets would be around $53,000 and then $59,000.
On the downside, immediate support is around the $46,500 zone, with an extended pullback likely to edge BTC price towards $43,250.
Check out our how to buy Bitcoin page here : https://coinjournal.net/bitcoin/buy/
Shiba Inu price
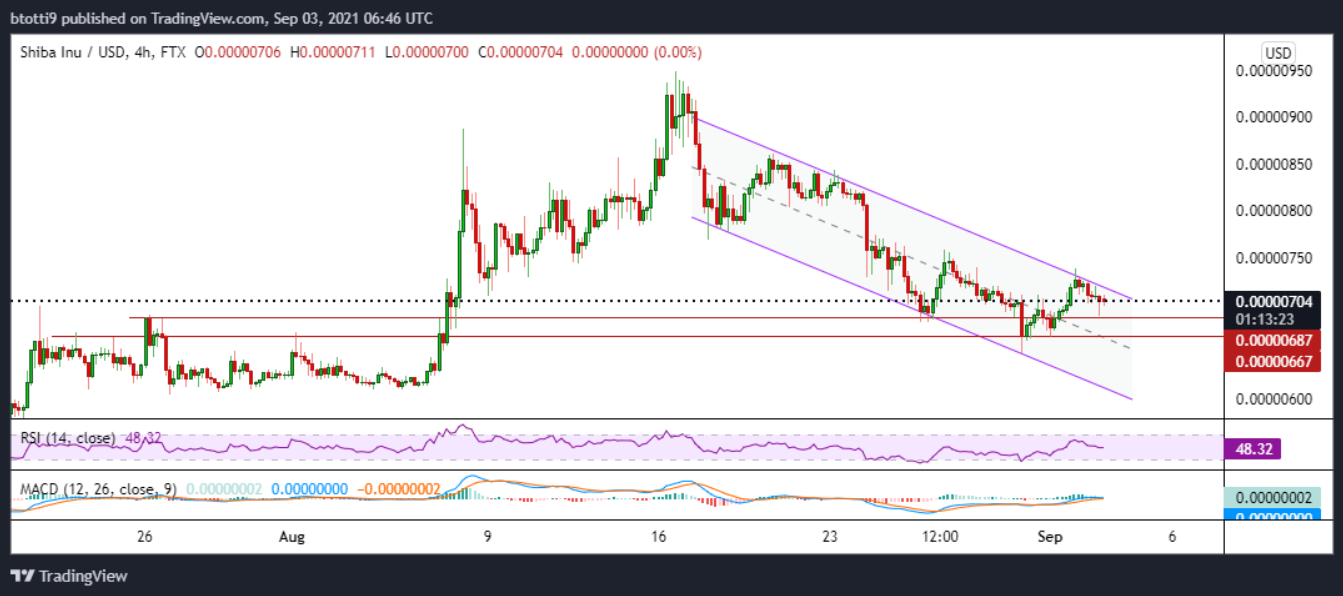
The SHIB/USD pair has declined 14% over the past two weeks, dropping from highs of $0.0000092 on 17 August.
The Shiba Inu coin price has therefore traded in a descending channel since, with bulls seeing multiple breakout attempts thwarted at the channel’s resistance line.
SHIB/USD 4-hour chart. Source: TradingView
The RSI below 50 and a weakening MACD suggest the downward path is more likely. Bears have retested the support line near $0.0000069 and could decline to $0.0000067.
However, bulls can breach the channel’s resistance if the price holds above $0.0000070. In such a scenario, SHIB/USD might rise to $0.0000072 and then $0.000075.
Vechain price
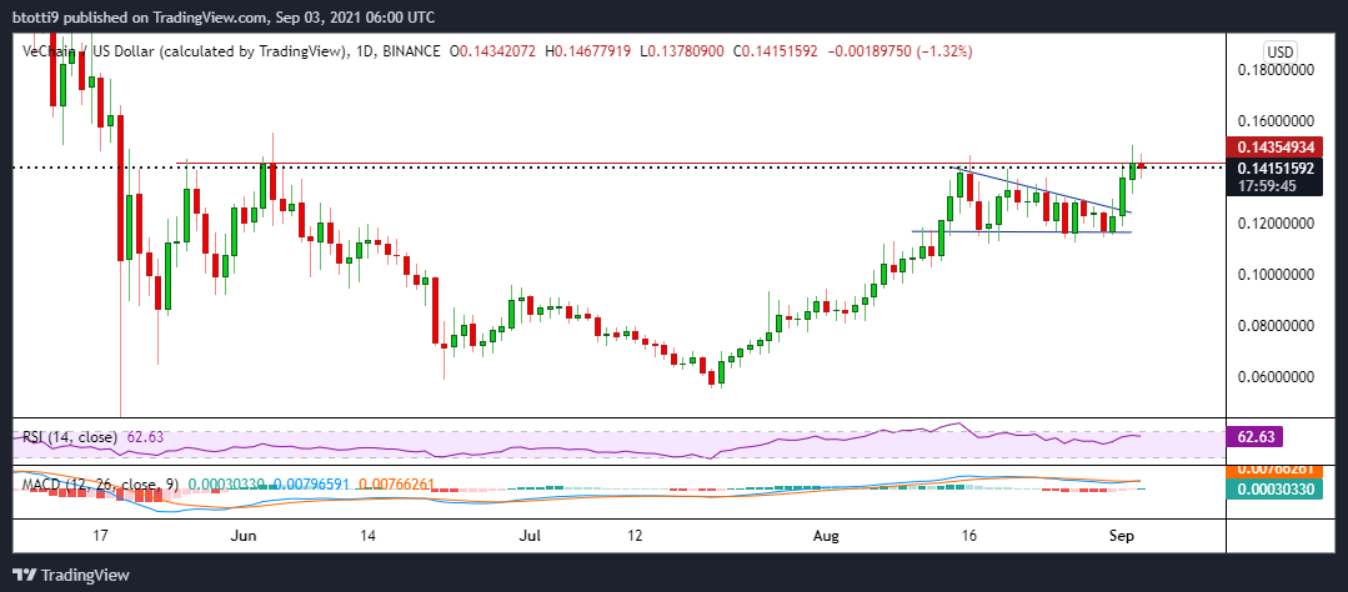
VET/USD is facing some downside pressure near $0.142 at time of writing, but bulls remain in control with the price 3.5% and 20% up in the past 24 hours and week respectively.
VET/USD daily chart. Source: TradingView
As seen on the chart, upward continuation is likely given the bullish flag pattern. The daily RSI is above 60 while the MACD suggests a bullish crossover to also support the bullish view.
Vechain price needs to successfully break the horizontal resistance near $0.147 (formed since early June) for bulls to target the $0.162 supply zone.
On the downside, bulls must hold above $0.137 to prevent further sell-side pressure towards $0.128 or lower.


