
BTC/USD Trades Below $29,800 Resistance
Join Our Telegram channel to stay up to date on breaking news coverage
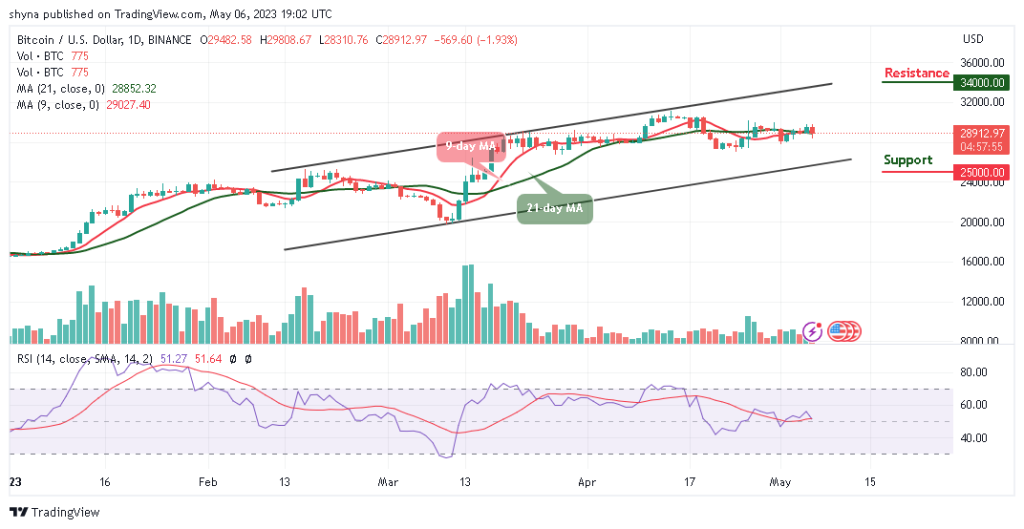
After touching the daily high of $29,808, the Bitcoin price prediction is down to touch a low of $28,310; a quick recovery seems possible for now.
Bitcoin Prediction Statistics Data:
Bitcoin price now – $28,912
Bitcoin market cap – $559.8 billion
Bitcoin circulating supply – 19.3 million
Bitcoin total supply – 19.3 million
Bitcoin Coinmarketcap ranking – #1
BTC/USD Long-term Trend: Ranging (Daily Chart)
Key levels:

Resistance Levels: $34,000, $36,000, $38,000
Support Levels: $25,000, $23,000, $21,000
After forming a short-term top, BTC/USD price slides and crosses below the 9-day and 21-day moving averages as the price consolidates around $28,912, with a few bearish signals. However, the recent correction to the upward failed near the $30,000 level and it seems like Bitcoin bulls are struggling to gain momentum above this level.
Bitcoin Price Prediction: Would Bitcoin Head to the Downside?
The Bitcoin price is currently hovering within the 9-day and 21-day moving averages, the $28,000 and $26,000 levels are initial supports if the coin heads to the downside. However, if the bulls fail to recover the recent high of $29,808, there is a risk of a sharp decline. However, if the bears drag the price below the lower boundary of the channel, then, Bitcoin (BTC) could drop to the critical supports of $25,000, $23,000, and $21,000 respectively.
Nevertheless, if there is a clear break toward the upper boundary of the channel, the Bitcoin price could hit the $30,000 resistance level. If the bulls manage to gain strength above $31,000, there are chances of a decent recovery toward the $32,000 resistance area. Moreover, the key breakout zone is near the $34,000, $36,000, and $38,000 resistance levels. Meanwhile, the Relative Strength Index (14) for the king coin is likely to cross below the 60-level, suggesting a bearish movement.
BTC/USD Medium-term Trend: Ranging (4H Chart)
The Bitcoin price is at the moment hovering below the 9-day and 21-day moving averages, trading at $28,845. Therefore, if the price drops below the lower boundary of the channel, it could reach the support level of $27,000 and below.
Nevertheless, if the bulls push the coin toward the upper boundary of the channel, the Bitcoin price may likely hit the potential resistance levels of $30,500 and below. At the moment, the market is ranging as the Relative Strength Index (14) indicator prepares to cross above the 50-level.
Alternatives to Bitcoin
The Bitcoin price could begin another decline if bulls failed to push the coin to the upside. At the opening of today’s trading; the king coin touches the resistance level of $29,010, but any bearish movement to the south may bring the coin down to the bearish zone. However, the AiDoge (AI) platform provides an AI-driven meme generation experience for users, adapting to the ever-changing crypto world. This employs advanced AI technology for creating relevant memes based on user-provided text prompts. Meanwhile, the key aspects include the AI-powered meme generator, text-based prompts, and $AI tokens for purchasing credits. Moreover, the token is currently at the presale stage raising almost $4m.
AiDoge – New Meme to Earn Crypto
Earn Crypto For Internet Memes
First Presale Stage Open Now, CertiK Audited
Generate Memes with AI Text Prompts
Staking Rewards, Voting, Creator Benefits
Join Our Telegram channel to stay up to date on breaking news coverage