3 Cryptocurrencies Hit Record Lows

During a significant cryptocurrency market drop on August 17, Internet Computer (ICP), SUI, and Apecoin (APE) all fell to new all-time lows.
While ICP has not yet closed below its main horizontal support level, SUI and APE crashed through theirs without a bounce.
Internet Computer (ICP) Price Closes Below $3.50
The ICP price has fallen under a descending resistance line since reaching a yearly high of $8.23 on February 18. The decrease led to a low of $3.35 on June 10, and the price bounced at the $3.50 horizontal support area (green icon).
However, ICP failed to sustain its increase. Rather, it was rejected by the resistance line again on August 14 and fell to a new all-time low price of $3.15 three days later.
Despite the decrease, the ICP price has not yet closed below the $3.50 horizontal support area. As long as it does not do that, the potential for a bullish trend reversal still remains.
If the decrease continues, the ICP price can fall by another 25% and reach the next support at $2.58. Since the price is at an all-time low, the 1.61 external Fib retracement is required to find the next closest support.
On the other hand, in case of a breakout, the price can increase by 30% and reach the next resistance at $4.50.
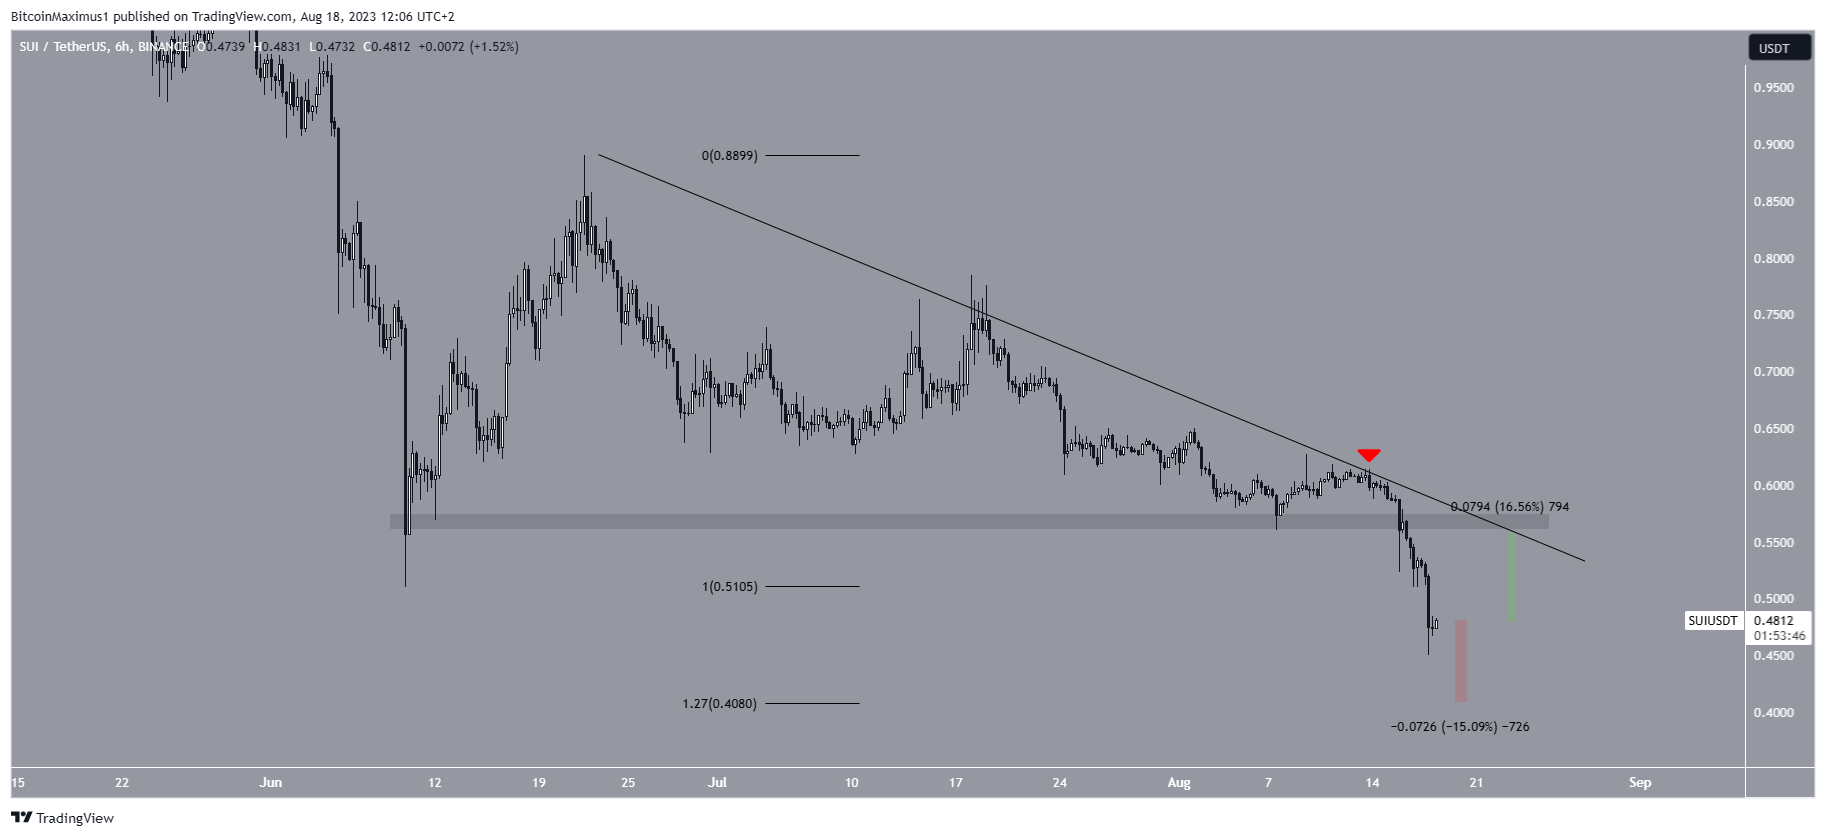
SUI Price Crashes Below Support
The SUI price has fallen under a descending resistance line since June 22. The line has caused numerous rejections, most recently on August 13. This catalyzed the ongoing decrease and led to a new all-time low of $0.45.
The next closest support is at $0.41, a drop of 15% measuring from the current price.

On the other hand, if the SUI price bounces, it can reach the descending resistance line at $0.55, an increase of 17% measuring from the current price.
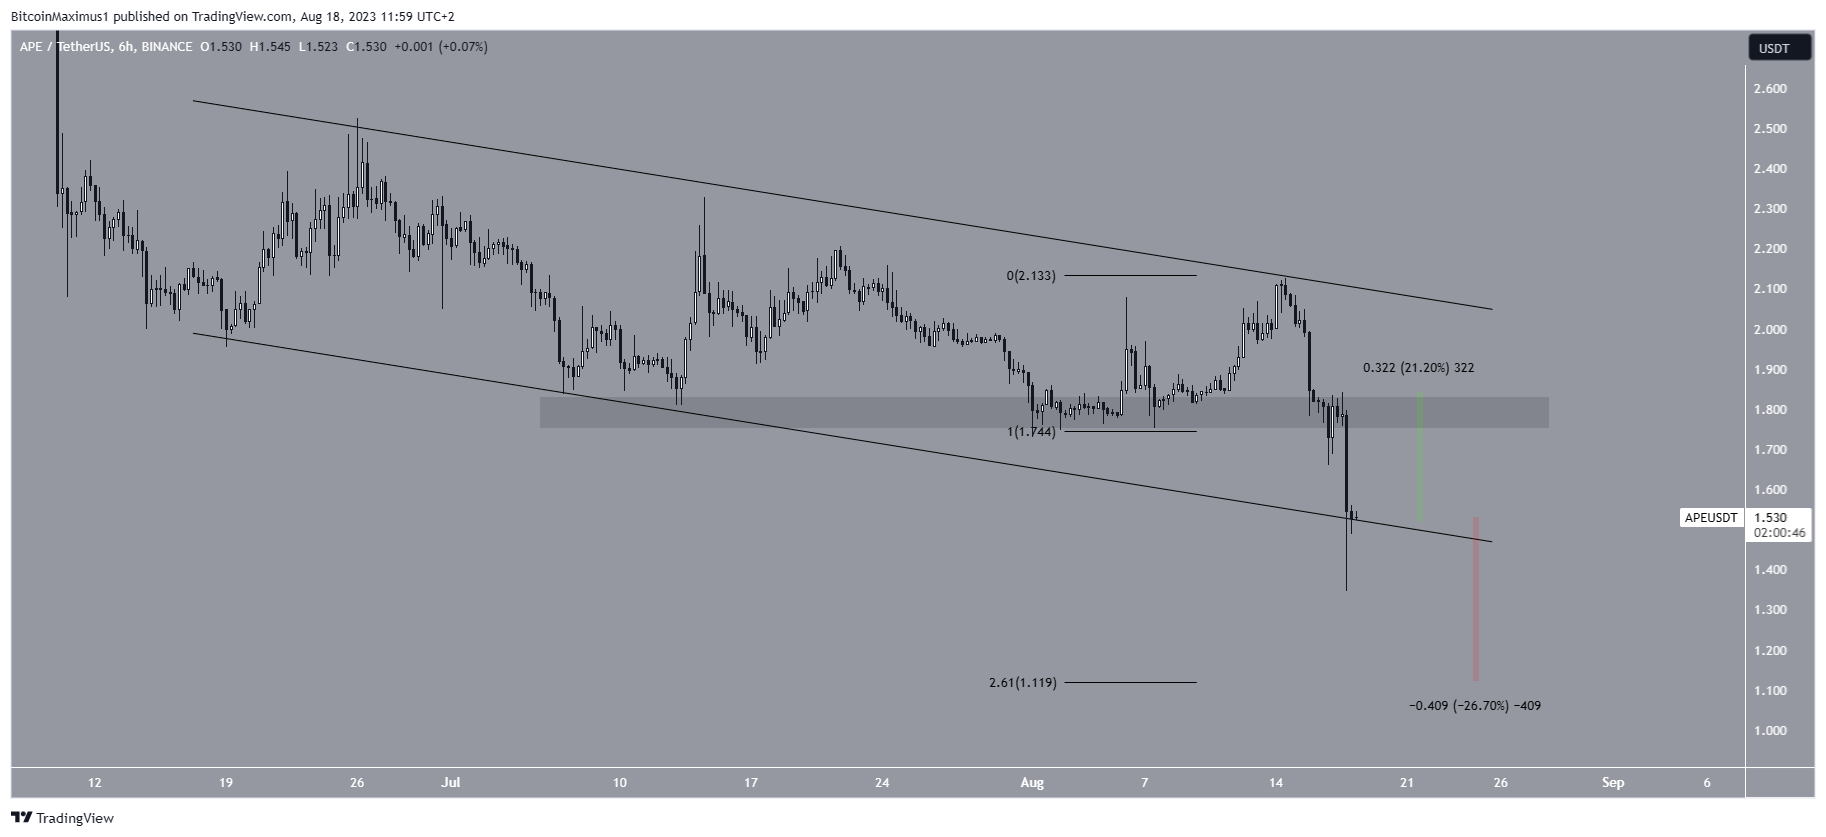
Can Apecoin (APE) Price Bounce at Support?
The APE price has fallen inside a descending parallel channel since June 17. These channels are considered corrective patterns. Therefore, an eventual breakout from it would be the most likely scenario.
However, the APE price broke down from the $1.80 horizontal support area on August 17 and reached a new all-time low of $1.34. This is a bearish sign and puts the possibility of a breakout from the channel at risk.

A strong bounce at the channel’s support line can lead to a 20% increase to $1.80. On the other hand, a breakdown from the channel would take the price to $1.11, a drop of 26% measuring from the current price.
For BeInCrypto’s latest crypto market analysis, click here.
Disclaimer
In line with the Trust Project guidelines, this price analysis article is for informational purposes only and should not be considered financial or investment advice. BeInCrypto is committed to accurate, unbiased reporting, but market conditions are subject to change without notice. Always conduct your own research and consult with a professional before making any financial decisions.


